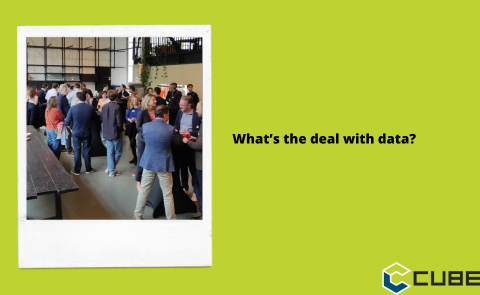
22 May What’s the deal with data?
There is more data than ever at the disposal of market researchers, but not all data is created equally. What is data quality and what does it consist of? Is AI a blessing or a curse regarding data quality? And what is the difference between a lazy cheater and a smart cheater? All these questions were answered at the latest Marketing Café that CUBE hosted, together with BAM.

CUBE invited two speakers to come and talk about the latest trends in data and data quality: Wilko Rozema from Dynata (who stepped in for his colleague Stefan Boom) and Kantar’s Jon Puleston. Rozema started his presentation by highlighting the ambiguous role of AI in today’s research efforts. Not only can it help providing answers to people who like to fraud, it also helps to build people’s opinions. “Which is equally worrying because then it’s not the consumer’s opinion anymore”, Rozema says. “On the other hand, AI can also be an opportunity, because it can help us check the data quality in itself. So AI really is a double-edged sword.”
Another reason to look at data quality from a different viewpoint, is the abundance of surveys, coupled with the ever-shortening attention span of Generation Y and Z. “How can we expect them to fill in ten minute surveys without losing attention, when their reference are 30 second TikToks”, Rozema wonders. One way of dealing with this phenomenon has been to remove certain participants in the survey. “I have seen examples of customers that remove people simply because they don’t want to fill an open app. In the consumer’s opinion they participated very reliably. The one thing they did not do, was to fill in the open apps. And after 10 or 15 minutes, they find out they will not earn their incentive. I highly doubt they will ever participate again, which is detrimental for the sustainability of our industry because the demand for participants is ever increasing.”
Translated text
At some point automation comes into play, argues Rozema. And that means more than checking for straightlining or speeding. “Are we really deleting the ones that are fraudulent or bad actors? Or are we deleting people that just made a few mistakes? And if you remove everyone that just made a mistake, you will have not a lot of respondents left to include in your sample. And that can create an intended bias in our opinion.”
There are already several tools that check surveys for, for instance, the copy-pasting of (translated) text from the internet, which is indicating the use of AI and for acceleration checks. Rozema showed a couple of examples that demonstrate that these tools are getting better at finding cheaters than humans. The “score” they give to people taking surveys is therefore a far better way to enhance the quality of the surveys than the “gut feeling” that most clients use.
Professional respondents
“We have now so much data on respondents that we can categorize them in four different groups: Lazy Cheaters, Smart Cheaters, Unengaged Real People and Perfect People. Lazy cheaters are easy to spot manually, with a lot of straight lining and open ends. Smart Cheaters are the worst, because they are much harder to spot. These are the automated scripts and the click farms. They are a real risk to your outcome.”
Unengaged Real People are the ones that should not have filled in the survey, Rozema explains. They come in different flavors (from slightly to very unengaged) and although the scoring tools often label them as “borderline”, sometimes it is a good idea to keep some of their answers. Perfect People are the rarest of the bunch. They form just a small part of any single panel and are sometimes called “professional respondents”. Rozema: “Nowadays it looks like everybody wants to keep them in their survey, because they give such good answers. But let’s take them out. Because they are biase, by the very fact that they give a perfect answer everywhere.”
Happiness is an air fryer
After Rozema, it was time for Jon Puleston to take the stage and talk about his experiences in research. Puleston was once part of the famous “Good Judgement Project”, essentially a prediction tournament organized by the American academic Philip Tetlock. “It taught me a lot about techniques to predict things. The first one was to look at thing from all possible angles: unpack problems in multiple dimensions and see if there are consistent answers that are reliable.”
An important piece of maths plays an important role here, Puleston explains. “Suppose you have two models. One that predicts 60% likelihood of something and another one that also predicts 60%. The average of these two is not 60%. It is more likely to be 70%. Because when you have two credible models that predict the same thing, the likelihood for it to happen, is higher than its sum. On the other hand: if one model says 60% and the other 40%, than the average is not 50%. It is probably lower, like 45%. You should never average models.”
Another important thing that Tetlock taught, was that the best predictors often change their mind. “Having an open mind and being ready to change your mind is critical. You have to try and avoid any fixed thinking patterns. Only in an ideal world charts show perfect correlations. We did a survey once to understand the secret of happiness. One of the questions was what items you owned. We discovered that the people who are the happiest own an air fryer. In the real world, data is mostly a jumbled group of dots. There is a lot of random noise in your data that you must process for. Whenever I see a chart with clear correlation, my suspicions are instantly aroused. I’m not thinking: here is a trend. I’m more likely to think: that is a data set that is corrupted.”
Random numbers
Puleston shows this with by doing a little experiment in the room. He shows people sales graphs of certain products and asks them if they think sales will go up or down in the future or if they will stay flat. The room enthusiastically participates, but what nobody knows is that the graphs are completely made up of random numbers. “We all want to see patterns in data that do not exist. To be able to be a good data analyst you have to put aside your personal ability to think you are good at spotting patterns. I think that the machine learning-techniques we have now are helping us navigate through that.”
Puleston gives another example of how difficult it is to predict the future. “The effectiveness of advertising in a marketing campaign is very difficult to predict, because there are so many other things involved. The only thing we can really measure about the effectiveness of ads are the strong signals. For example, we have identified a link between liking an ad and it doing well. That is a strong signal. Was it memorable? Was it surprising? Was the branding strong? So, we end up with these very simplistic measures that give us a proxy idea about whether the ad is going to go well or not. The problem with that is that these are very raw bits of data, and they are really good at evaluating certain types of advertising.”
Our speaker shows a boring ad for a skin care brand. “Most respondents evaluating this ad don’t like it. It is patronizing. It is formulary. It is generic advertising messaging. It is very difficult to really engage with this ad. Yet, in reality, out in the open market this ad performed really well. It knocks the brand out of the park in terms of sales. It is an incredibly successful ad. It is just that the framework we are evaluating is not apparent from the basic measures you traditionally use, like “Do you like the ad?”.”
Let’s stick together
Conclusion: you should never try and create a unified model, says Puleston. “Always recognize that models don’t scale up and they don’t scale down. So how do you gather insights from data? There are lots of different approaches. You can just noodle through the data and find stories, or you can look for theories and see whether that’s been validated in the data. Or you can do an iterative protocol of looking for things and then thinking about what that means and then look through the data.”
Effective data analytics is about being able to ask questions of your data, Puleston explains. But often the best questions come from analyzing the data itself. “I would recommend a protocol to research, analyze and research again and linking these two. Often the researchers and the analysts sit in different parts of the building, and I would really advocate sticking those two people together and merging those forces. The final thought is: the worst mistake you can make is actually not encompassing enough data in your thinking process.”
